

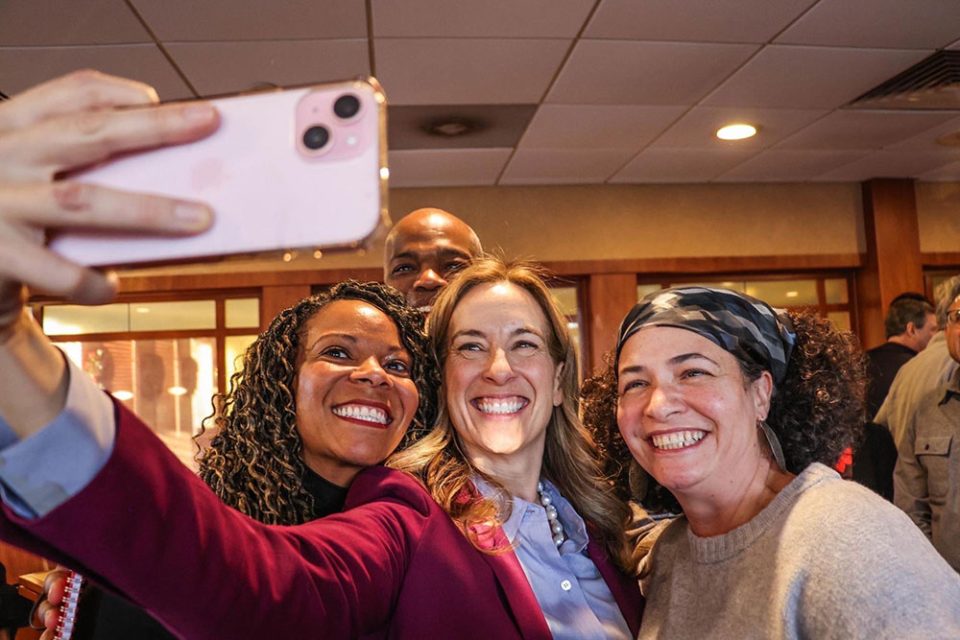
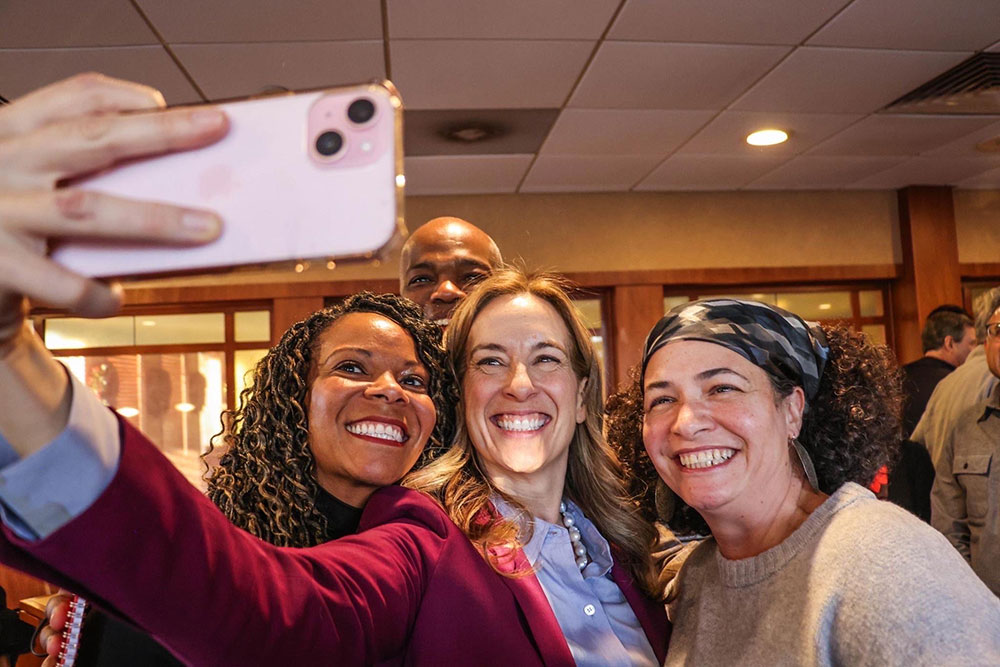
Election2025: NY Times Takes On Spiller’s ‘Unconventional Strategy’
April 9, 2025
A Tale of Two Special Ed Systems: Comparing City and Suburban School Districts in NJ
April 14, 2025How Can New Jersey Manage Costs and Improve Outcomes For Students With Disabilities?
Edunomics Lab of Georgetown University just published an analysis of special education spending to “better understand the extent to which rising identification rates and staffing increases deliver value for students.” The analysts conclude that states “are making different choices” about how to best serve students with disabilities and “those choices are delivering wildly different results for students.”
In other words, states with higher identification rates and staffing increases don’t necessarily get better results for students with disabilities. The context for this information is the national trend, according to an attendant presentation, of identifying more students with disabilities while overall enrollment goes down. This is not necessarily good: according to a NAEP analysis, for instance, identifying students with disabilities does not improve their reading proficiency levels. (What improves reading skills? Enforcing better reading instruction.)
While the teacher shortage is largely over, the exception is special education where staff postings make up 24% of all teacher postings but special ed teachers make up 12% of the workforce. (Math is close behind.)
Each state gets its own profile. Driving the profile are prompts for local school boards to examine whether special education has become a “dumping ground” for struggling students; whether boards are using data to evaluate which strategies are improving student outcomes, whether they are over-identifying or under-identifying students. Here are the takeaways for New Jersey, where annual costs for special education run about $5 billion a year.
*Among states, New Jersey spends the 5th highest percentage of education dollars on special education.
*New Jersey classifies 18% of students as eligible for special education services. This is higher than the national rate of 16%.
*Over the last decade, NJ schools identified 22,342 (10%) more students with disabilities even as enrollment declined by 8,012 students (-1%).
*Here is the breakdown of NJ classifications: 31% of classified students have learning disabilities (including dyslexia); 25% have a speech or language impairment; 21% have Other Health Impairment (including ADD, ADHD); 12% have autism; 9% are in one of the other nine categories.
*NJ special education programs spend most of their money on labor. There is one full-time staff member per 6 students with disabilities. Fifty-five % are teachers, 10% are specialists, and 35% are para-professionals. This trend is national, with staff increases not for teachers but for other roles (paid for primarily through emergency Covid funds) even though having more non-teacher staff doesn’t correlate with higher student outcomes.
*The NJ eighth grade map gap in proficiency between students with and without disabilities is close to the national average. The fourth grade gap in reading is lower than in most other states.
What can New Jersey learn? Edunomics gives this advice, both student-centered and budget-centered (which are not mutually exclusive!):
- Improve Tier I reading instruction (evidence-based, standards-aligned) to reduce referrals for reading-related disabilities.
- Avoid the compliance mindset (ratios, etc.).
- Leverage available flexibility. Tackle misaligned incentives.
- Consider what tech tools can help.
- Examine trends in identification to help uncover what’s driving increased referrals.
- Scrutinize your special education budget and compare the costs to outcomes for students.
- Improve reading instruction, which may help reduce referrals for reading-related disabilities and benefit all kids.
- Focus on quality over quantity of staff, which could better support learning while containing costs
- Remember staff-heavy special education programs aren’t correlated to better reading outcomes for students.
- Remember higher identification rates do not correspond to better outcomes for special education students.
- Improve reading instruction for all students in order to get better scores for special education students.

