

New Jersey Ranks Last In the U.S. For Including Students With Disabilities
December 20, 2023
What The Heck Is Going On In Asbury Park Today?
December 21, 2023At Five Newark Schools, Only One Third Grader Passed the State Reading Exam
Therese Jacob is a journalist at Tapinto Newark, where this was first published.
At 12 schools, fewer than 10% of third graders are able to read at grade level
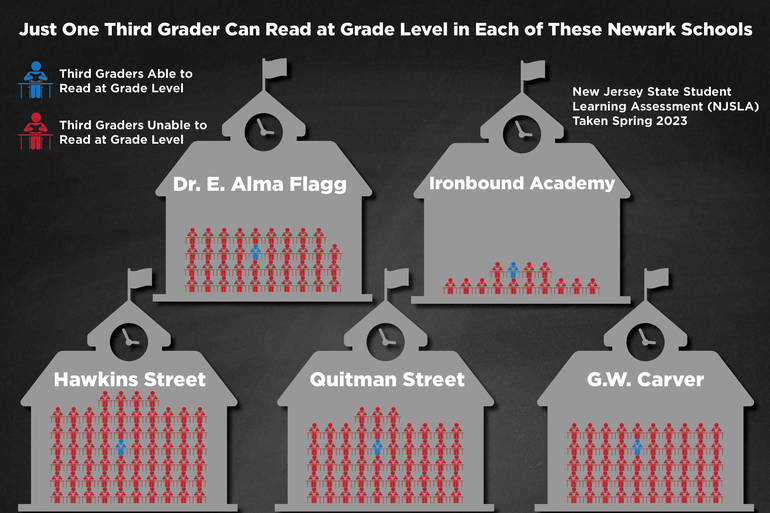
At Hawkins Street School 64 third graders took the state reading exam last Spring.
Just one passed.
It wasn’t any better at Quitman Street School, where one out of 53 third graders passed the exam. Same at George Washington Carver, where out of the 50 third graders, only one passed. Out of 39 students tested in third grade at Alma Flagg School, one passed. Similarly, one out of 14 students passed at Ironbound Academy, a new school in the East Ward.
At five other Newark elementary schools, only three third graders passed in each of the schools: Michelle Obama, Grover Cleveland, Harriet Tubman, Rafael Hernandez and Lincoln Elementary. TAPinto Newark obtained the passing figures on a student basis per school from an Open Public Records Act request.
In September, the Newark district revealed tha, overall, 19% of third graders in Newark passed the reading exam, unchanged from the year before. Hidden in averages, however, is the fact that some schools are far above 19% and some schools are far below.
“The third grade reading scores in Newark are sounding the alarm that this is a crisis,” said Vivian Cox Fraser, the president & CEO of the Urban League of Essex County.
“There must be an emergency call to action to avert the coming catastrophe,” she said. “The district is no longer under state control. The Newark school board must ensure that the children in the district are educated and prepared for their futures. The scarce resources of the district need to be deployed strategically to improve reading instruction. This issue must be at the top of the agenda of every school board meeting. There are examples of schools in Newark, both district and charter, whose third grade students are passing. The School Board needs to find out what they are doing.”
Schools Superintendent Roger León said during a September Board of Education meeting that “the data that we shared now is … alarming, it should scare everyone,” but laid blame on the Covid-19 pandemic that forced students online after schools closed.
“The last thing I want to do is say the C word over again, but I want everyone to understand that the impacts of the pandemic are very real and are lived and will be lived.”
Leon said it will take “five years and almost four months for every student in our school district to actually undo the realities of what happened.”
The extent of the damage caused by the pandemic revealed itself more fully last week when the New Jersey Department of Education released Spring 2023 test scores in math and reading for all schools.
For instance, the highest performing school last Spring in third grade reading was the Sir Isaac Newton Elementary School, which had 16 third graders, half of whom passed, for a passing rate of 50%. Fifteen out of the 32 third graders at Ivy Hill Elementary School passed, while 53 of the 126 third graders at Ann Street School passed.
But not all fared as well. Half of all of Newark Public Schools’ elementary schools scored under 15% proficient in third grade.
Charter schools’ third grade scores were double on average than the district at 39% vs. 19%. But that average, too, masked a wide range of results among charter schools, from a 65% proficiency rate at Gray Charter School and 63% at Maria Varisco Rogers Charter School to a 15% pass rate at Philip’s Academy and 18% at New Horizons Charter.
Three other charters had passing rates of 50 percent or higher: North Star Academy, Robert Treat Academy, and Newark Educators.
Third grade is considered a milestone year for reading.
“By third grade people are learning to read. After third grade, you’re reading to learn,” said Mayor Ras Baraka in July when announcing a Citywide 10-Point Literacy Plan to improve the reading skills of children prenatal through grade 3. Baraka said the low scores from the Spring test “are exactly what propelled us to bring our best literacy minds together to formulate” the plan.
“Neither I, nor any of the brain trust members we mobilized into action, expect the plan to impact scores before 2024 – and we are committed to staying the course with the involvement of our schools, our parents and families, and the community at large,” Baraka said.
“Recent Newark high school scores look completely different and are very encouraging,” the mayor said. “The intention is to collectively take responsibility for our children’s literacy, and we have every reason to expect it’s not too late to get results from a robust city-wide collaboration.”
At many of the schools where large percentages of children failed the state exam, a deeper look at the figures show that the majority of the students are at the lowest level possible out of the five possible reading levels for third grade.
At George Washington Carver Elementary School, 80% of students scored at the lowest level. At Lincoln Elementary, 75% scored at the lowest, while 69% scored at the lowest level at Dr. E. Alma Flagg School, Grover Cleveland Elementary School, and East Ward Elementary School.
“I think that one of the most important conclusions that we can draw is that those numbers don’t need to be what they are,” said Scott McConnell, professor emeritus of educational psychology at the University of Minnesota.
“We can’t entirely discount the influence of the pandemic. Those are kids that their schooling was significantly disrupted during the times that learning to read is high on the list. That may be a factor here, but my hunch is it’s not the only factor and that we shouldn’t give too much credence to that being the sole determinant,” McConnell said.
| School Type | School | Proficiency Rate | Number of test takers | Number passing |
| Charter | The Gray Charter School | 65.6% | 32 | 21 |
| Charter | Maria Varisco Rogers Charter School | 62.7% | 59 | 37 |
| Charter | North Star Academy Charter School | 58.6% | 534 | 315 |
| Charter | Robert Treat Academy Charter School | 54.8% | 82 | 45 |
| NPS | Sir Isaac Newton Elementary School | 50.0% | 16 | 8 |
| Charter | Newark Educators Community Charter School | 50.0% | 26 | 13 |
| NPS | Ivy Hill Elementary School | 46.9% | 32 | 15 |
| Charter | Roseville Community Charter School | 42.6% | 47 | 20 |
| NPS | Ann Street School | 42.1% | 126 | 53 |
| Charter | Newark Charter Average | 39.5% | ||
| Charter | Achieve Community Charter School | 33.8% | ||
| NPS | First Avenue School | 33.7% | 101 | 34 |
| NPS | Park Elementary School | 29.3% | 75 | 22 |
| NPS | Lafayette Street School | 27.5% | 120 | 33 |
| Charter | Team Academy Charter School | 27.5% | 556 | 153 |
| NPS | Mckinley Elementary School | 26.4% | 57 | 15 |
| NPS | Oliver Street School | 25.2% | 99 | 25 |
| NPS | Luis Muñoz Marin Elementary School | 25.0% | 64 | 16 |
| NPS | South 17th Street School | 25.0% | 32 | 8 |
| NPS | Wilson Avenue School | 24.8% | 117 | 29 |
| Newark | Newark-Wide Average | 24.4% | ||
| NPS | Abington Avenue School | 23.3% | 86 | 20 |
| NPS | Michelle Obama Elementary School | 23.1% | 13 | 3 |
| NPS | Salome Ureña Elementary School | 22.9% | 35 | 8 |
| NPS | Speedway Avenue School | 22.7% | 66 | 15 |
| Charter | Great Oaks Legacy Charter School | 22.3% | 153 | 34 |
| NPS | Mt Vernon Place School | 22.2% | 81 | 18 |
| NPS | Peshine Avenue School | 21.1% | 38 | 8 |
| Charter | Marion P. Thomas Charter School | 21.1% | 90 | 19 |
| NPS | Ridge Street School | 20.4% | 54 | 11 |
| NPS | NPS Average | 19.1% | ||
| NPS | Hawthorne Avenue School | 18.6% | 43 | 8 |
| Charter | New Horizons Community Charter School | 18.2% | 33 | 6 |
| NPS | Belmont Runyon Elementary School | 17.6% | 51 | 9 |
| NPS | Chancellor Avenue School | 16.7% | 48 | 8 |
| Charter | Philip’S Academy Charter School | 15.5% | 84 | 13 |
| NPS | Roberto Clemente Elementary School | 15.1% | 73 | 11 |
| NPS | Dr. William H. Horton Elementary School | 15.0% | 60 | 9 |
| NPS | Thirteenth Avenue School | 12.2% | 41 | 5 |
| NPS | Louise A. Spencer Elementary School | 12.0% | 58 | 7 |
| NPS | South Street Elementary School | 12.0% | 75 | 9 |
| NPS | Franklin Elementary School | 11.9% | 67 | 8 |
| NPS | Grover Cleveland Elementary School | 11.5% | 26 | 3 |
| NPS | Avon Avenue School | 10.3% | 39 | 4 |
| NPS | Camden Street Elementary School | 9.5% | 84 | 8 |
| NPS | Elliott Street Elementary School | 9.5% | 42 | 4 |
| NPS | Sussex Avenue School | 9.1% | 44 | 4 |
| NPS | Harriet Tubman Elementary School | 8.8% | 34 | 3 |
| NPS | Lincoln Elementary School | 7.5% | 40 | 3 |
| NPS | Rafael Hernandez School | 7.5% | 40 | 3 |
| NPS | Ironbound Academy Elementary School | 7.1% | 14 | 1 |
| NPS | East Ward Elementary School | 4.1% | 97 | 4 |
| NPS | Dr. E. Alma Flagg School | 2.6% | 39 | 1 |
| NPS | George Washington Carver Elementary School | 2.0% | 50 | 1 |
| NPS | Quitman Street School | 1.9% | 53 | 1 |
| NPS | Hawkins Street School | 1.6% | 64 | 1 |


